Codon Usage and Context Analysis
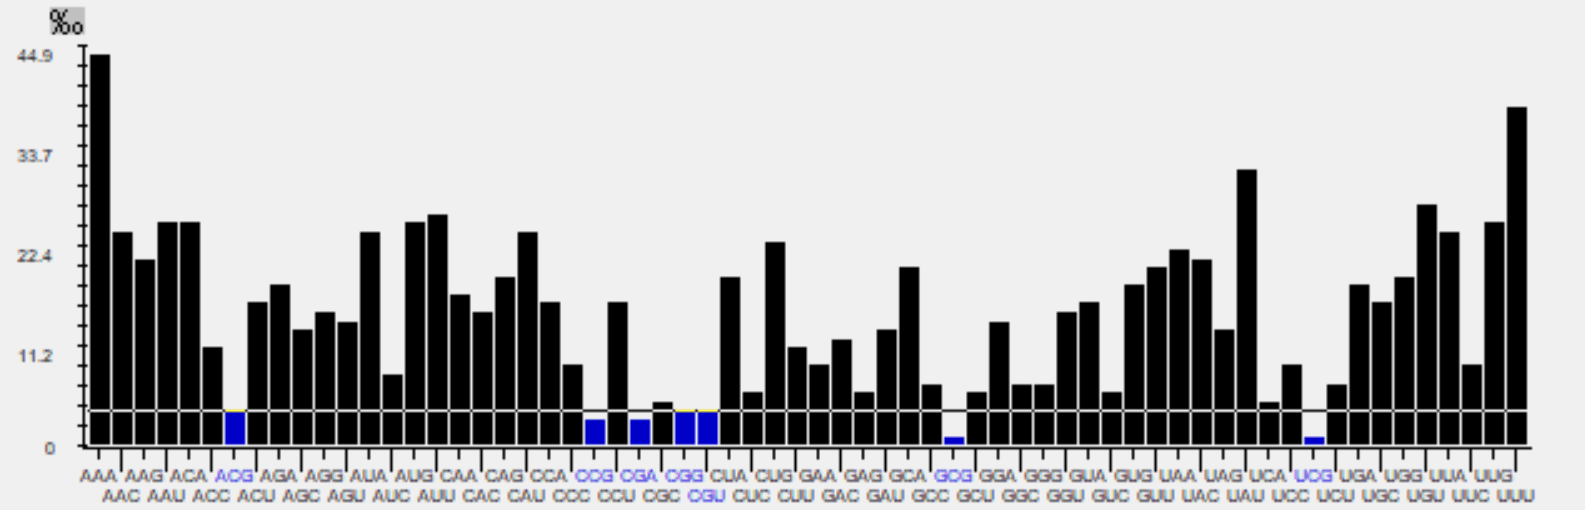
For codon usage and context analysis numerous ways of analyzing codon usage, such as Effective number of Codons (ENC) values 87, nucleotide contents, and relative synonymous codon usage (RSCU) values were analyzed and summarized. Codon bias is measured by the number of times (row frequency) a codon is used for each amino acid. Anaconda programme was used to look at the distribution of rare and preferred codons as well as codon context among APV9 strains.
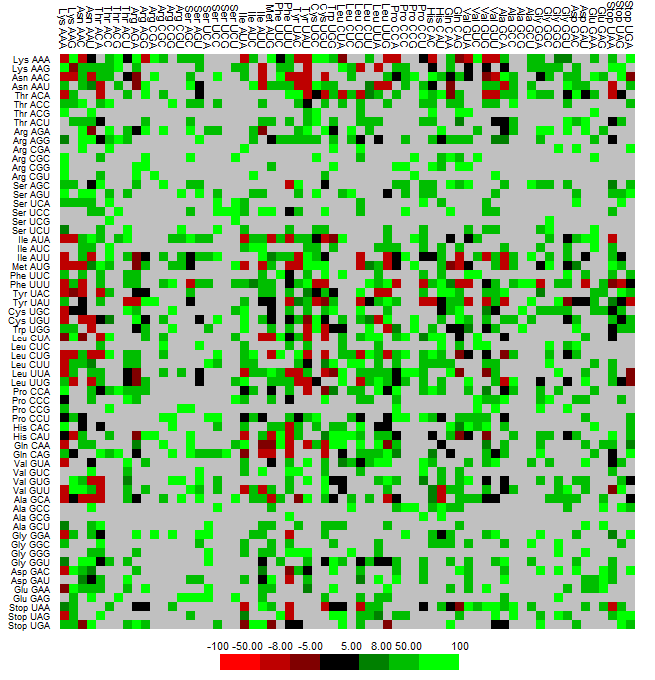
The frequencies and patterns of codon usage vary within and between genomes. Nucleotide composition bias, gene length, recombination events, expression level, and G+C content among other things, all have an impact on it. This uneven use of synonymous codons could be extremely helpful in discovering and comprehending species-specific genome evolution patterns. Anaconda programme was used to estimate codon context. This program aids in calculation of known residual values for each codon pair's involvement in genomes. Through a chi square test, this residual value demonstrates a link between two codons in each context. For the entire number of codon pairs, average residual values were determined. A two-colored heat map was generated for each value in a frequency table cell for an APV9 nucleotide sequence with accession id - LC626346.1. Green and red colors represent preferred and rare codons, respectively, in the matrix. The cluster pattern of the matrix demonstrates both variations and similarities in codon context between species.Similarly, the black color of the cells denotes residual values related to codon context that do not match to biasness.
click image to interact
The geographical evolution of this species group was also analyzed by constructing another phylogenetic tree using the inbuilt feature at the NCBI Virus site, which matched HPV subtype evolution to their country. This tree was constructed to determine the link between isolates from various nations. 96 sequences with legitimate isolation sources were included in this study, and the resulting phylogenetic tree as shown below demonstrated that nations share comparable subtypes of species due to their geographic proximity. Additionally, the relationship between subtypes and countries was analyzed: HPV 35 is prevalent in Africa, South America, and a few Asian nations (India, Thailand, and Georgia), HPV 16 is prevalent in Brazil, India, and Nepal, while HPV 52 and HPV 33 are prevalent in Brazil.
click image to interact